Champagne, decoded.
8,000 vineyard parcels and the champagnes made from them. From the chalk beneath the vines to the bottle in your hand, Parcelles connects the land of Champagne to the wines it makes.
Get the app
Every vineyard in Champagne, browsable and searchable. Subregions, villages, classifications. No account needed. No paywall for the basics.
Explore over 8,000 parcels. Tap any vineyard to see its name, village, classification, and area.
Find any vineyard, village, or producer instantly. Full-text search across the entire Champagne database.
Switch between cartography, standard, and satellite views. See the vineyards from every angle.
Champagne, unfolded.Every grower's office in Champagne has one: a parcel map on the wall, creased from folding, annotated over generations. Parcelles is that map, with the chalk, the weather, and the vintages folded in. A region this size deserves a bigger table.
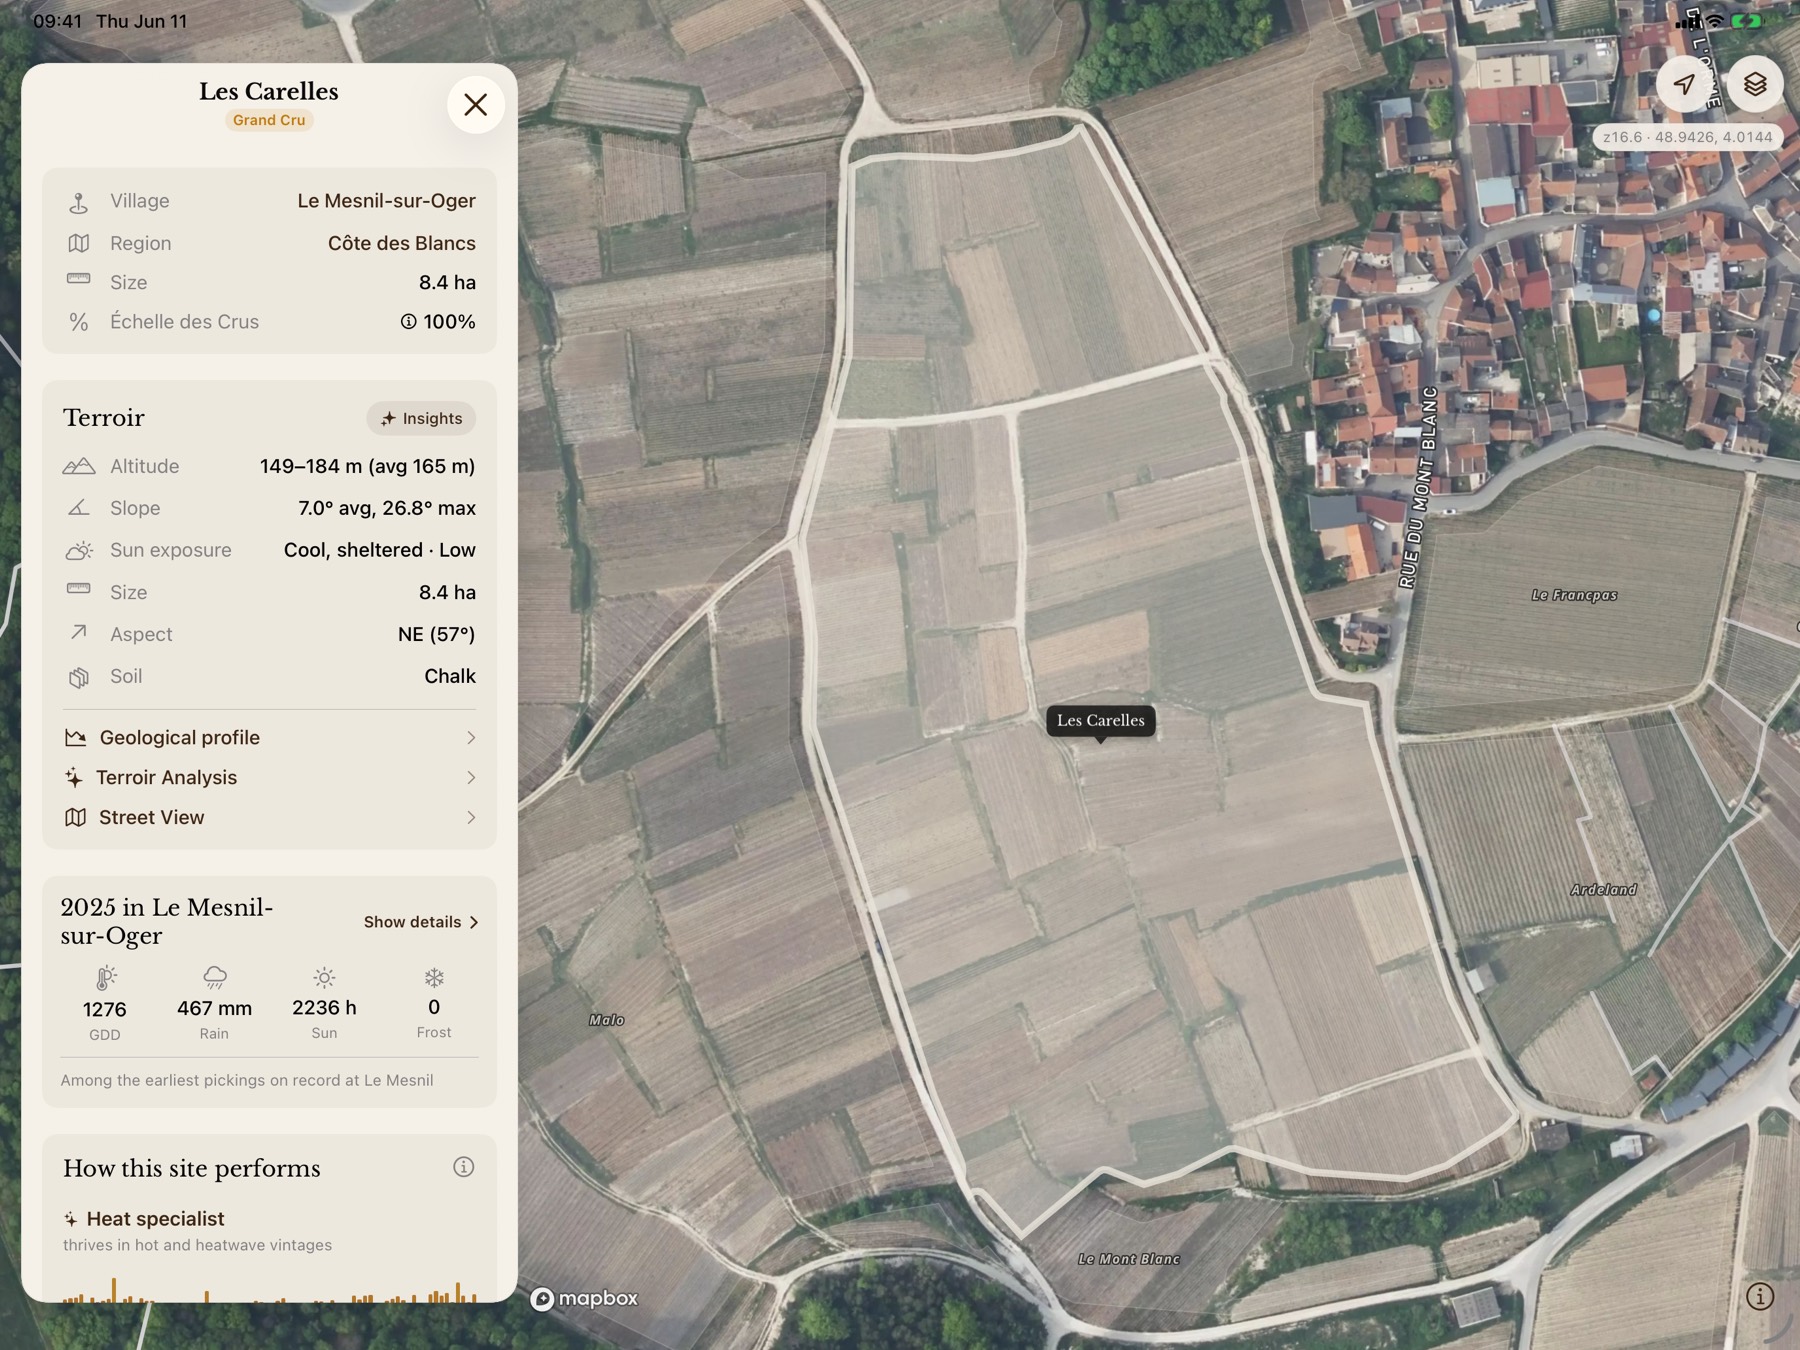
Membership unlocks the hidden dimensions of every vineyard: geological structures, soil composition, topography, exposure, and microclimate, plus full traceability from parcel to bottle.
Every single vineyard profiled with altitude, slope, aspect, sun exposure, soil composition, and geology, ranked against all of Champagne. See exactly where each vineyard stands and what makes it unique.
Elevation profiles with surface geology and projected underground rock layers reconstructed from boreholes. Hillshade, contour, and geology map overlays bring the terrain to life.
Geology, contour lines, hillshade, one tap, and the map reveals what lies beneath the vines.
Consensus quality ratings for every Champagne vintage back to 1950, stars, harvest dates, frost and hail events at a glance.
Visiting Champagne? See which vineyards surround you in real time, numbered on the map and sorted by distance. Tap any parcel to dive straight into its terroir.
Costs less than what you opened last weekend.
Browse every champagne of the region and open each bottle up: its blend grape by grape, the parcels it draws from, and a passport of all you have tasted. The vintage dossier, the season behind every bottle, is for members.
Membership brings predictive analysis to every vineyard. Performance scores for every vintage since 1950, climate projections, vineyard comparisons, and tools to discover parcels with the same terroir fingerprint, or the same behaviour across decades.
Growing degree days, rainfall, and sunshine decade by decade since 1950. See how climate has shaped the vines, and which trends are accelerating.
1976. 2003. 2018. Three record-breaking summers, decades apart. The data shows which parcels weathered each one best.
Not every vineyard handles the same weather the same way. Every parcel is scored against every vintage since 1950, revealing which plots thrive in heat, which ones need cool years, and which deliver regardless.
The 2003 heatwave destroyed some parcels and elevated others. Now you can see which, and why.
Read the same map through different lenses: long-term track record, terrain physics like solar exposure and frost drainage, climate projections through 2040, and per-variety resilience for Chardonnay, Pinot Noir, and Meunier, because each grape faces a different future.
Switch the lens, change the story. A vineyard's terrain advantage in one overlay can read as a frost trap in another, and a Pinot Noir stronghold in a third.
One membership. Every layer of Champagne, always up to date.
Insights from the data behind Parcelles.
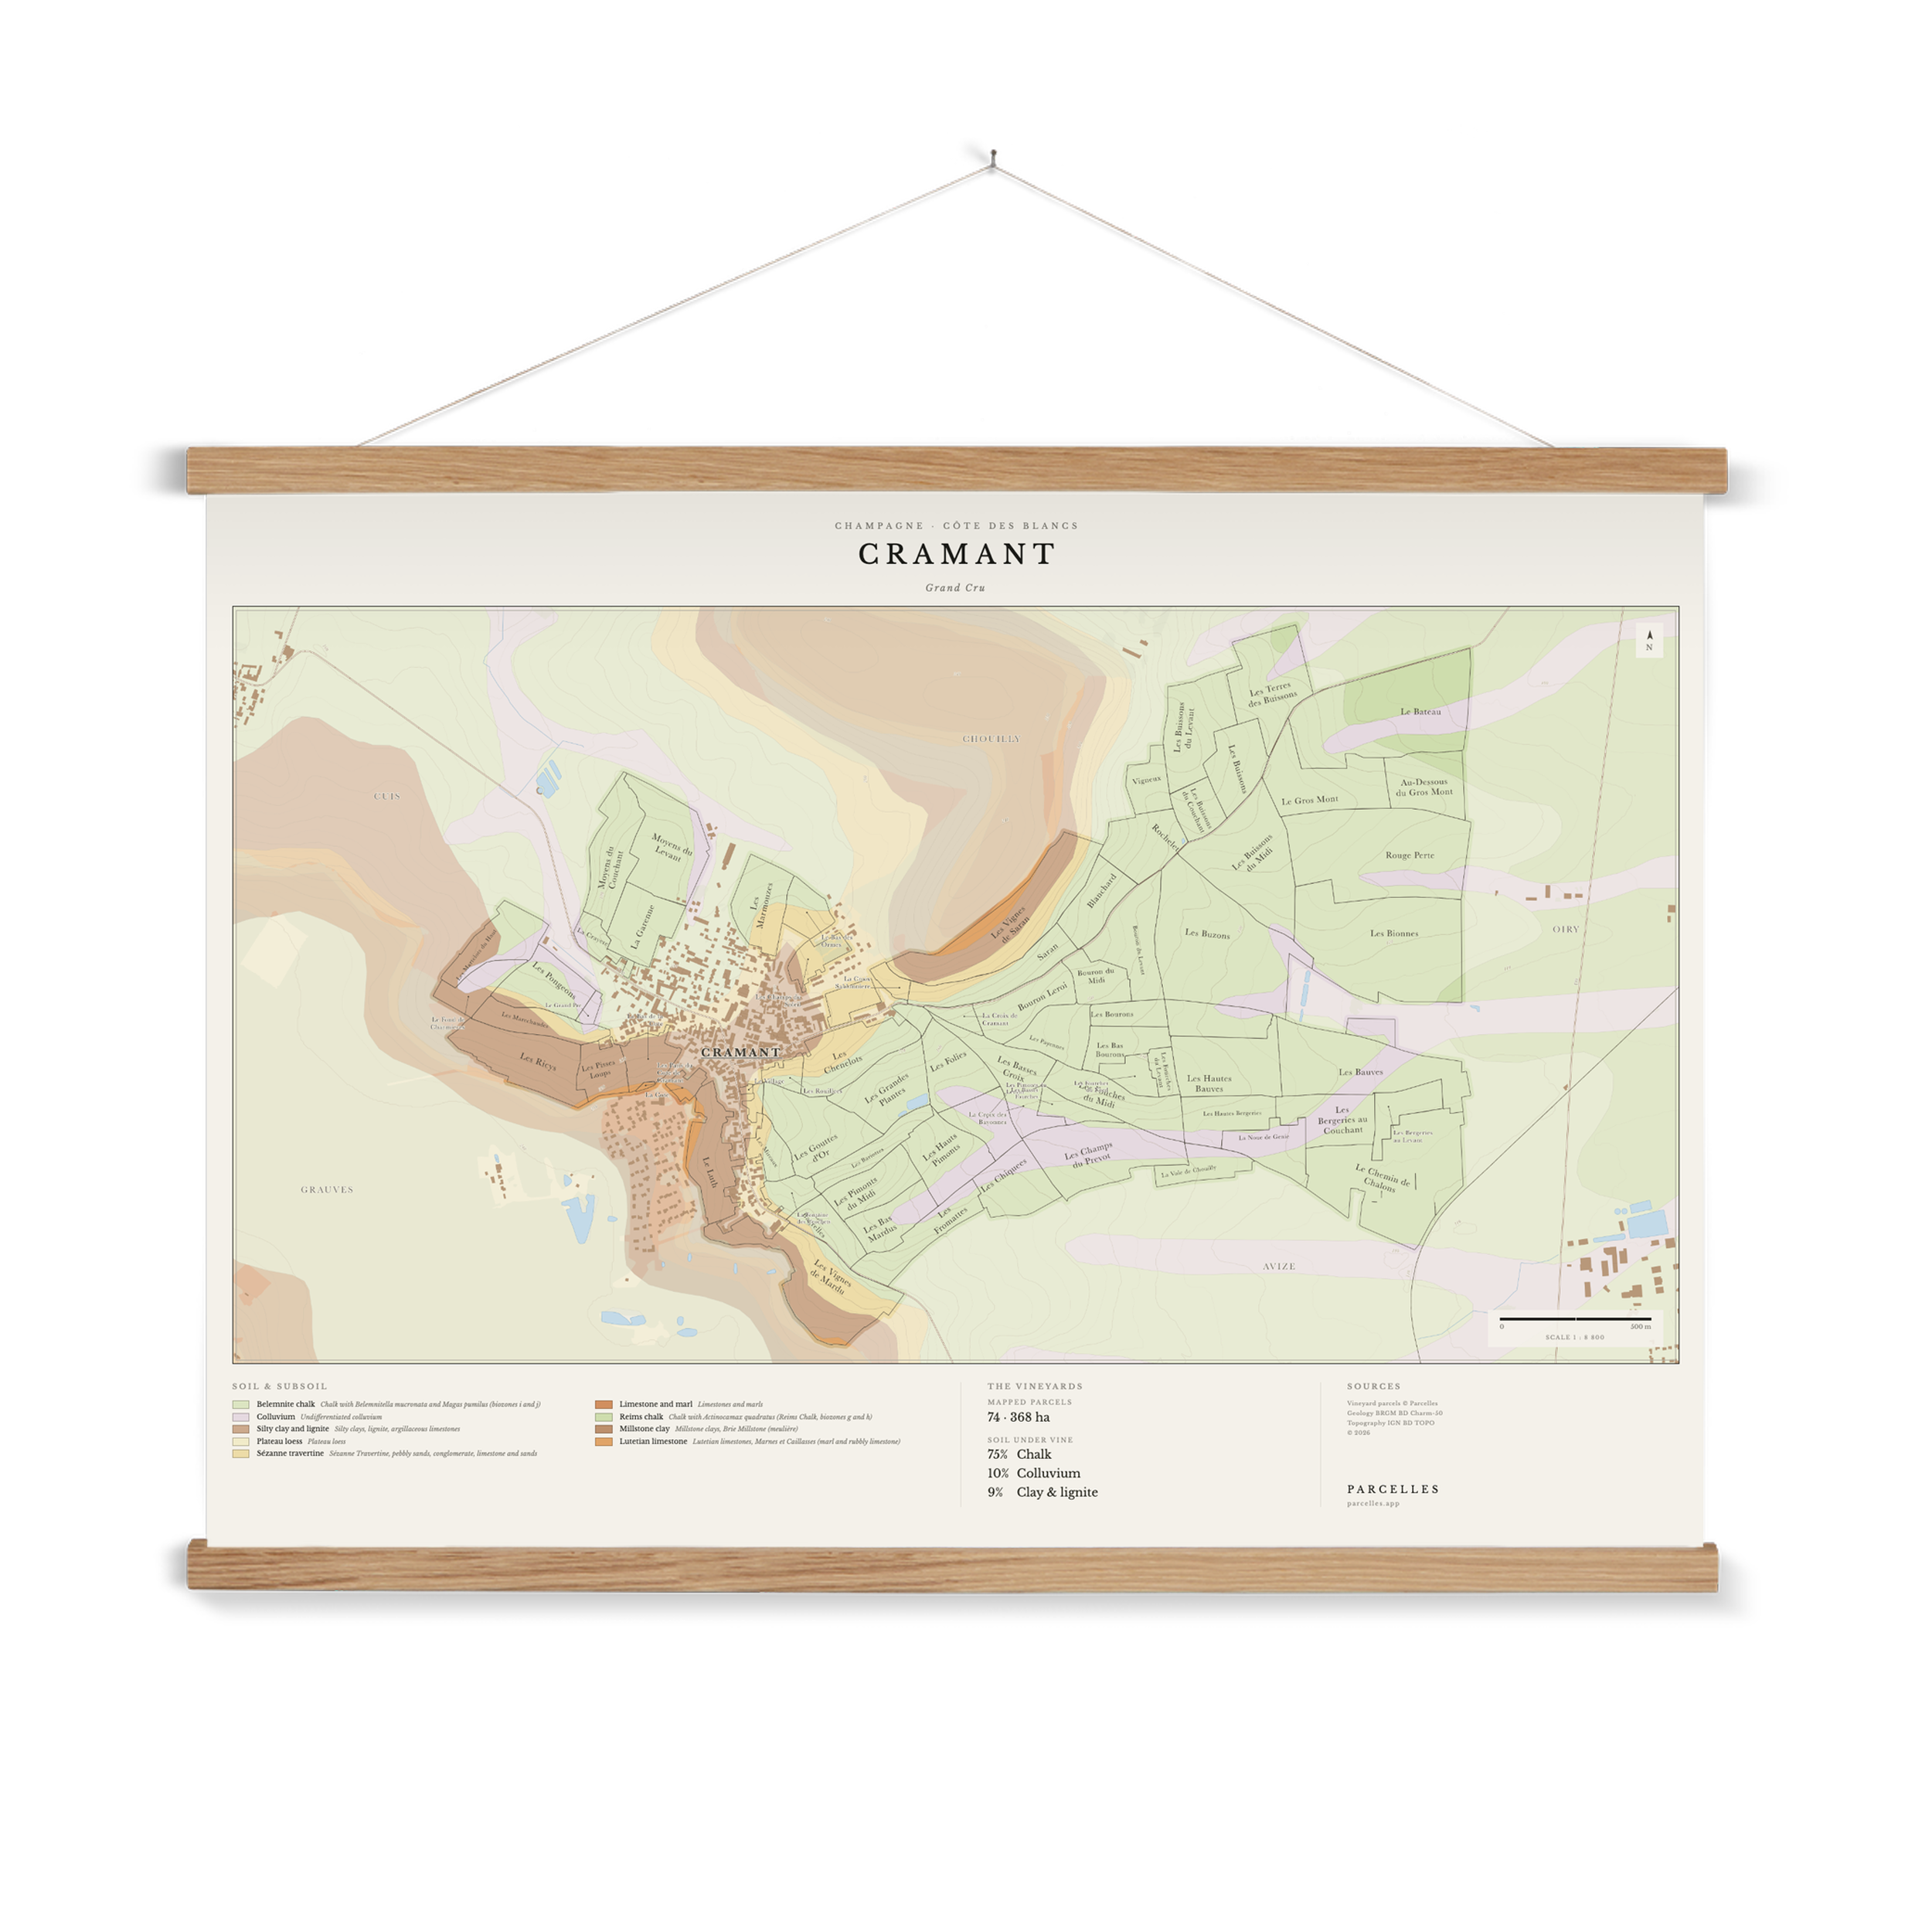
Pick a village in Champagne. We turn its soil and parcels into a museum-quality giclée print on heavyweight matte art paper, mounted with a solid oak wood hanger with magnetic fastening.
Printed with water-based inks on sustainably sourced paper and wood. Vegan-friendly. Shipped in rigid cardboard tubes with eco-friendly packaging.
Shop village postersChampagne has over 8,000 vineyard parcels, each shaped by millions of years of geology, unique microclimates, and centuries of winemaking tradition. Yet there was no single place to explore this data. It was scattered across government archives, academic papers, and local knowledge passed down through generations. I built Parcelles to bring it all together — so that anyone with a curiosity for Champagne can understand what makes each vineyard unique, from the chalk beneath the soil to the bottle in your hand.

Roman Blum
DipWSET
Get the app
Every vineyard, every village, mapped in detail.
No account needed · Membership optional