 Parcelles
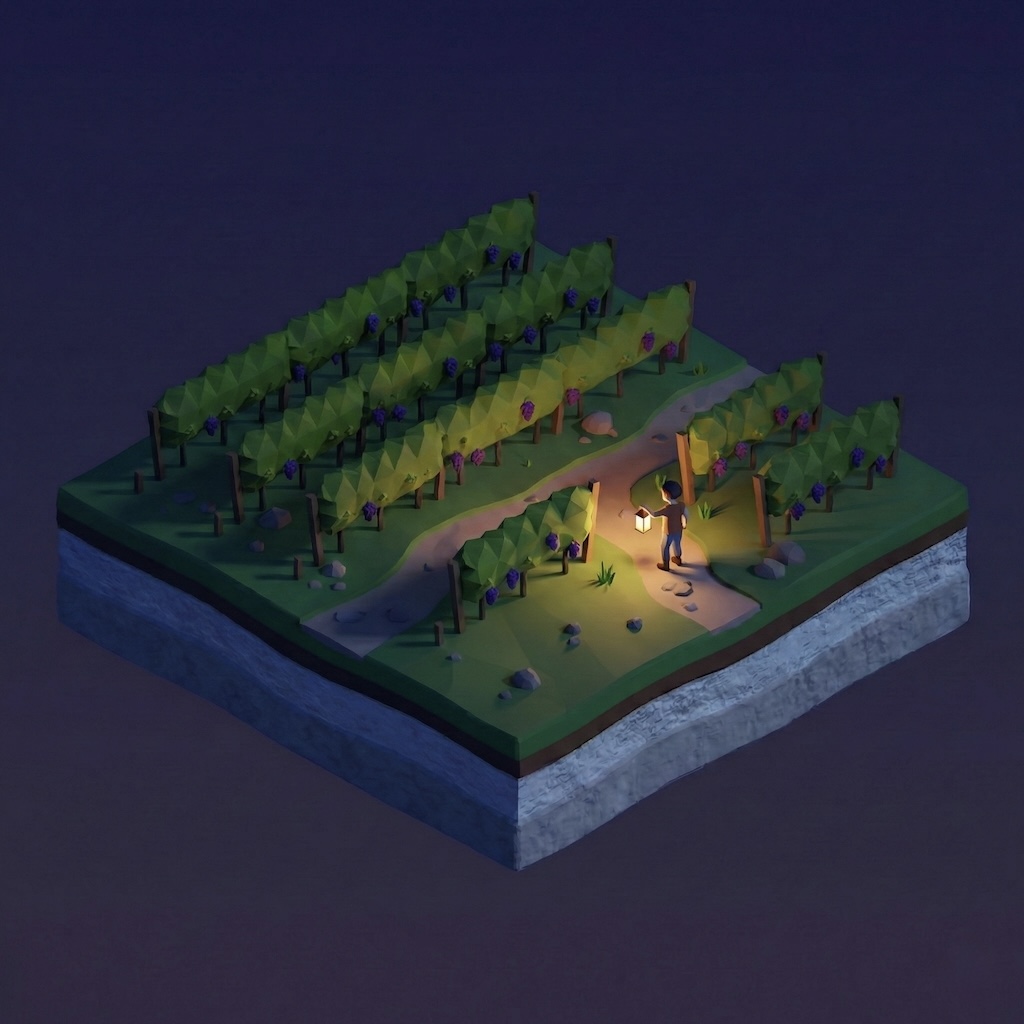
A few nights every April, Champagne holds its breath. Growers stand in the dark among candles and wind machines, watching thermometers hover around zero, because the vines have already committed: budburst has happened, the season has begun, and everything green is now hostage to the weather. From that night until the presses start, usually sometime between late August and early October, a vintage is decided one day at a time.
For most of Champagne's history, that unfolding story was read in the vineyard and remembered in notebooks. Today it can be read in numbers, and the numbers turn out to be remarkably good at telling you where the season is heading, months before the harvest confirms it.
A sum of warm days
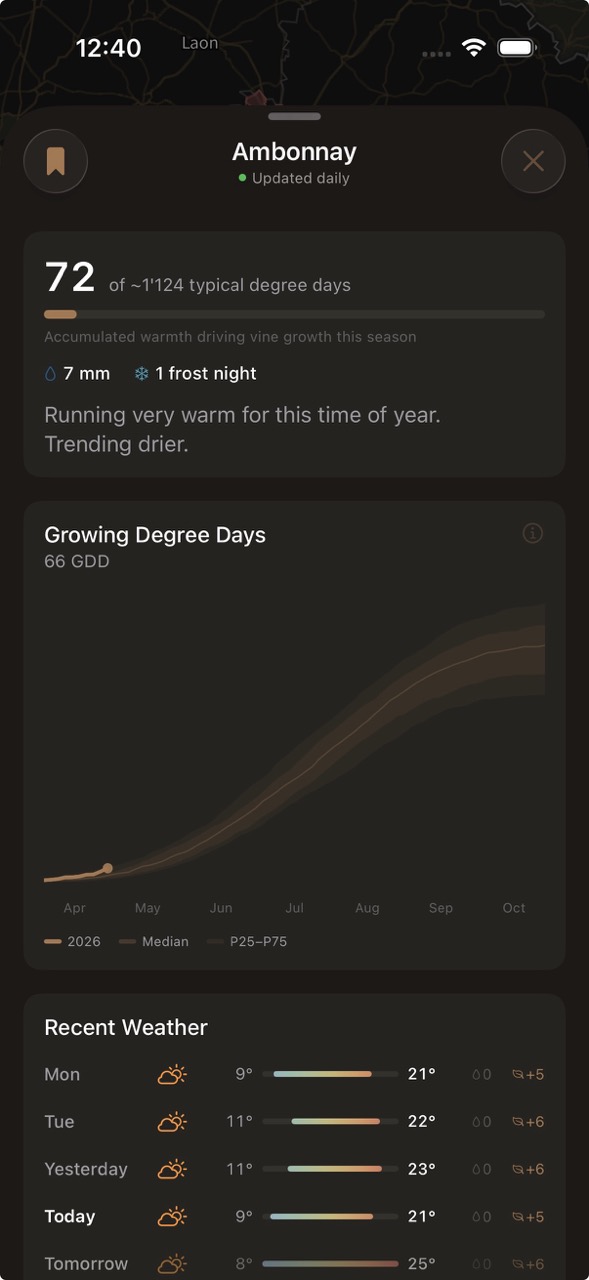
The vine keeps no calendar. It responds to accumulated warmth, and the standard way to measure that is the growing degree day, or GDD. The arithmetic is almost embarrassingly simple: take each day's average temperature, subtract 10 °C (below that, a vine essentially stands still), and add up whatever is left over the season. A cool April day contributes nothing. A 25-degree July day contributes 7.5. The running total is the season's heartbeat.
What makes GDD powerful is that vine development tracks it far more faithfully than it tracks the date. Two seasons can be weeks apart on the calendar and nearly identical in accumulated warmth, and the vines will behave like twins. Plot the running total against six decades of history and you can see, at a glance, whether a season is running warm, cool, or right on the long-term line.
The rhythm of the season
Every Champagne season passes the same four milestones. Budburst in April, when the buds open and the frost clock starts ticking. Flowering in June, a nervous two-week window where cold or rain can cut the crop before it exists; whatever sets here is the harvest, there are no second chances. Véraison in late July or August, when the berries soften and turn, and ripening proper begins. And then harvest, which in Champagne traditionally arrived about a hundred days after flowering.
Each milestone sits at a roughly known position on the GDD curve, which is what turns tracking into forecasting. If flowering finishes early and the curve is running above the historical line, the hundred-day rule starts compressing, and an experienced reader of the curve can name the harvest window in June with unsettling accuracy.
No two villages have the same season
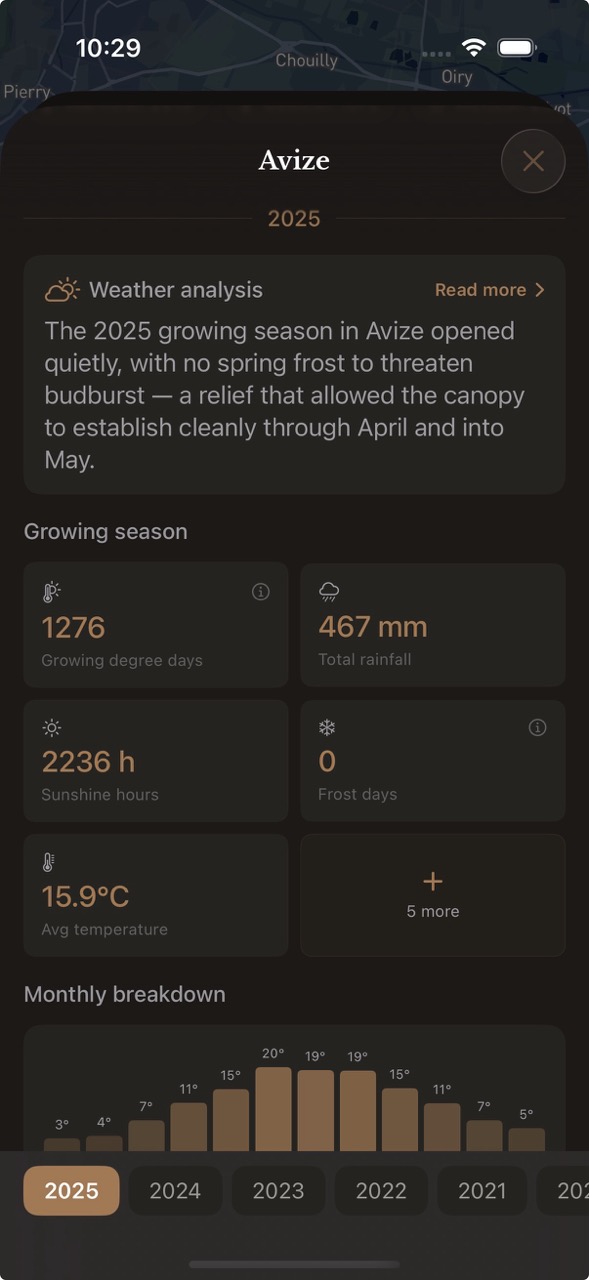
The regional average is a fiction, useful only for headlines. Champagne stretches nearly 150 kilometres from the Massif de Saint-Thierry to the Côte des Bar, and on any given day its villages are living different seasons. A June heat spike can hand the southern Aube villages twice the daily warmth of the cool slopes north of Reims. Frost is more local still: it pools in valley floors and spares the hillsides fifty metres above, which is why one grower can lose half a crop on a night a neighbour sleeps through.
This is also where the season connects back to terroir. A south-facing slope in Avize accumulates warmth on a different schedule than a north-facing one in Verzy, and the gap between them is not noise; it is exactly the difference the crus were named for. Tracking the season village by village turns an abstraction, "a warm June", into something a map can show.
From tracking to prediction
Early in the year, a season could still become almost anything, and honest forecasting says so: in April, the four archetype probabilities sit close together. Every warm week that follows moves them. By midsummer the distribution has usually collapsed toward one or two candidates, and by véraison the season has, in effect, declared itself.
By midsummer the season has usually told you what kind of year it wants to be. The tracker's job is to catch it saying so.
Harvest prediction works the same way, from the other end. Decades of history record how much accumulated warmth each village had reached when picking began. Project the current curve forward, find where it crosses that threshold, and you have an estimated harvest window, with honest error bars that narrow as the season progresses, plus the closest analog vintage: the past season this one most resembles.
None of this replaces walking the rows, and it does not try to. What it replaces is the fog: the six months of "we'll see" between budburst and the first press. The season will still surprise, a hailstorm respects no model, but you can now watch it unfold with the same numbers the region's own agronomists read.